How we know it works
Merlin is tested on questions it has not seen.
A model that has read the answers is not being tested. So before an audience is built, a portion of the real research is withheld. Merlin then predicts the responses to those withheld questions, and its distribution is compared against what people actually said.
- Withhold
Keep a slice of the real answers out of the data the audience is built from.
- Predict
Ask Merlin the withheld questions, exactly as they were asked of real respondents.
- Compare
Score the two response distributions against each other.
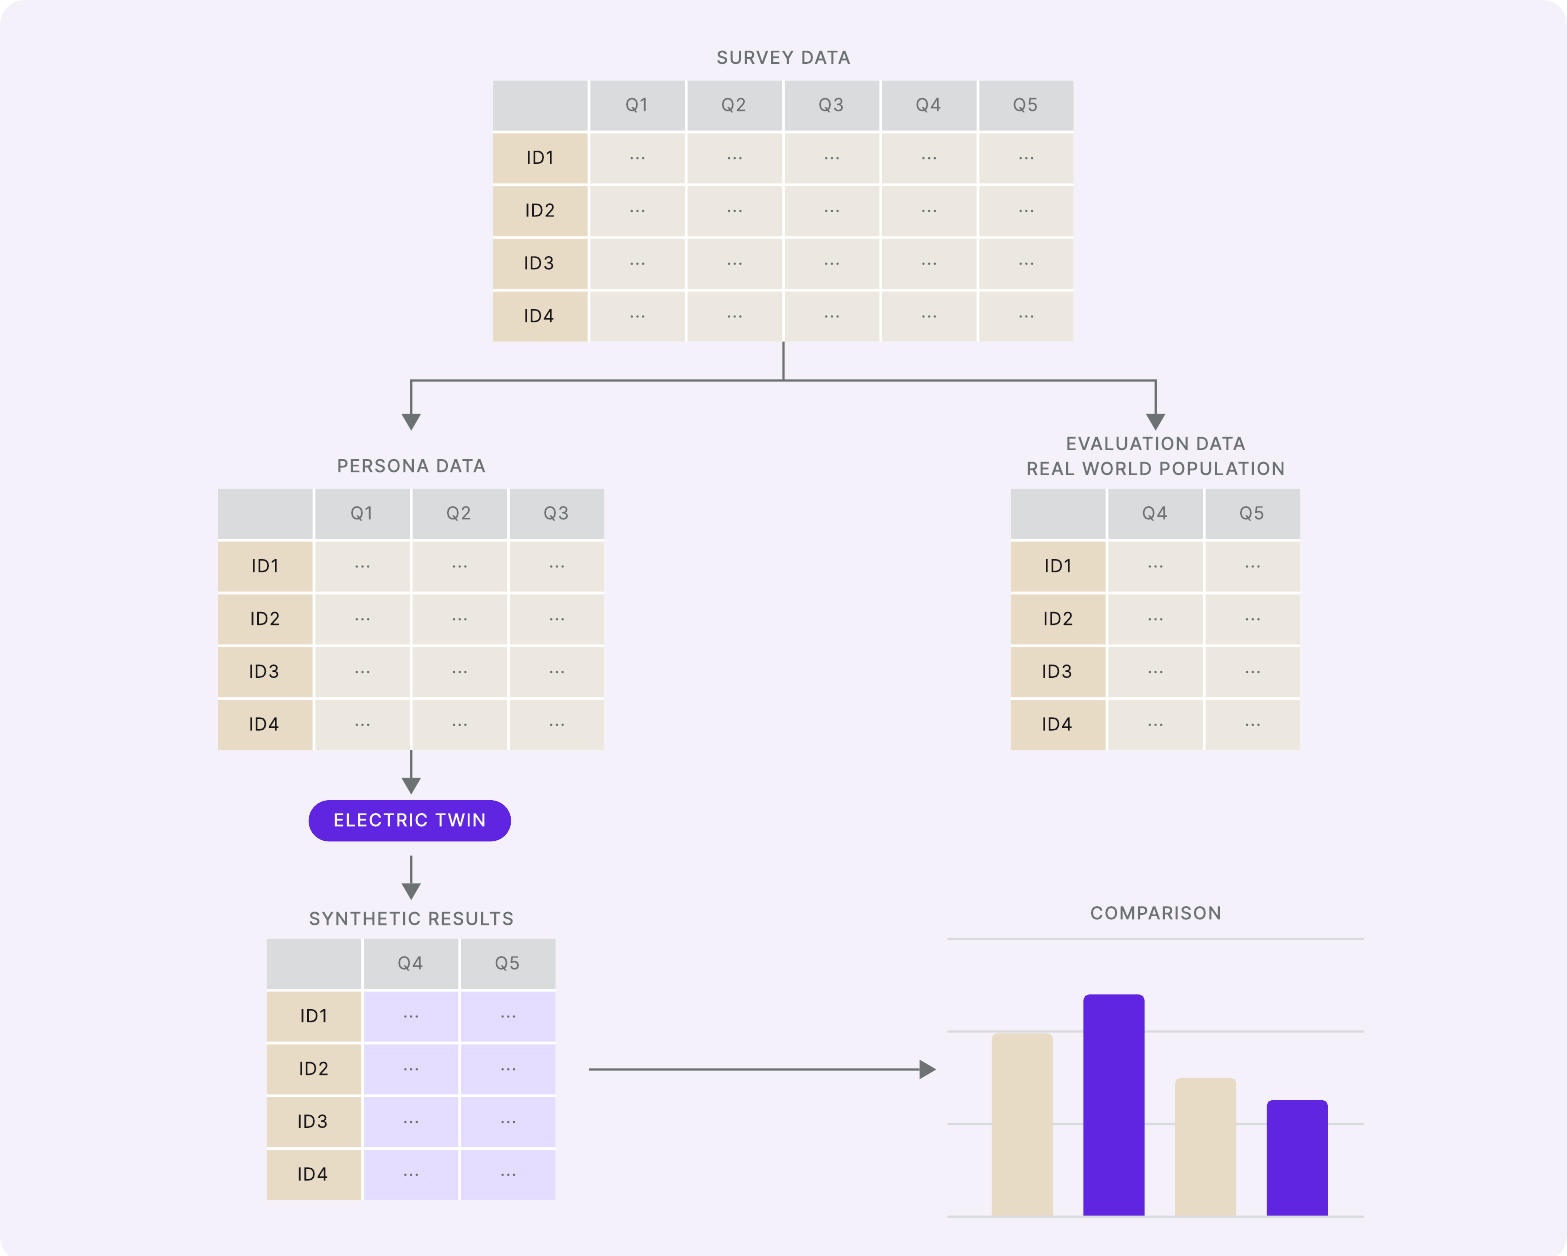
The split. Personas are built from one part of the survey data; the rest is held back so the predictions can be scored against real answers to the same questions.
How the data is separated
The whole method depends on the evaluation questions never reaching the personas. Electric Twin enforces that in three steps:
- Dataset partitioning
Every dataset splits in two. Persona creation data is used to construct the synthetic personas with their demographic and contextual information. Evaluation data is held out completely during persona creation and used only for testing predictions.
- Prevention of data leakage
Evaluation questions are never included in persona creation. This is what forces a persona to answer from its characteristics rather than from a memorised answer — the difference between a prediction and a lookup.
- Comparative analysis
The synthetic population answers the same held-out questions, and the two sets of responses are compared directly.
More than 30,000 evaluation runs of this kind have informed the current architecture.
What the numbers say
The headline metric is NDAM, an accuracy score for comparing two distributions. It has been run across internal datasets spanning UK and US populations.
92% distribution accuracy across hundreds of survey hold-out tests — against a human noise level of 94%.
Limit: Company-produced evaluation. Performance varies by audience and by task.
In a pre-registered comparison against eight conventional survey modes, Merlin ranked fourth on average.
Limit: A comparison on the surveys tested, not proof for every future question.
Read the source ↗Electric Twin reports 92% accuracy against a 10% hold-out from a known subscriber audience.
Limit: One customer example, not a universal benchmark.
Read the source ↗The 94% is the number that matters
Ask a real person the same question twice in the same survey and they do not give you the same answer 6% of the time. That is the human noise level: the ceiling any method is working against, including conventional research.
Merlin sits at 92% against a 94% ceiling. That framing is far more useful than "92% accurate", because it says what the remaining gap actually is — roughly two points off the point where a survey stops agreeing with itself. It is also the honest answer to "but is it as good as asking real people?", since asking real people is not perfectly reproducible either.
Accuracy has moved, and can move again
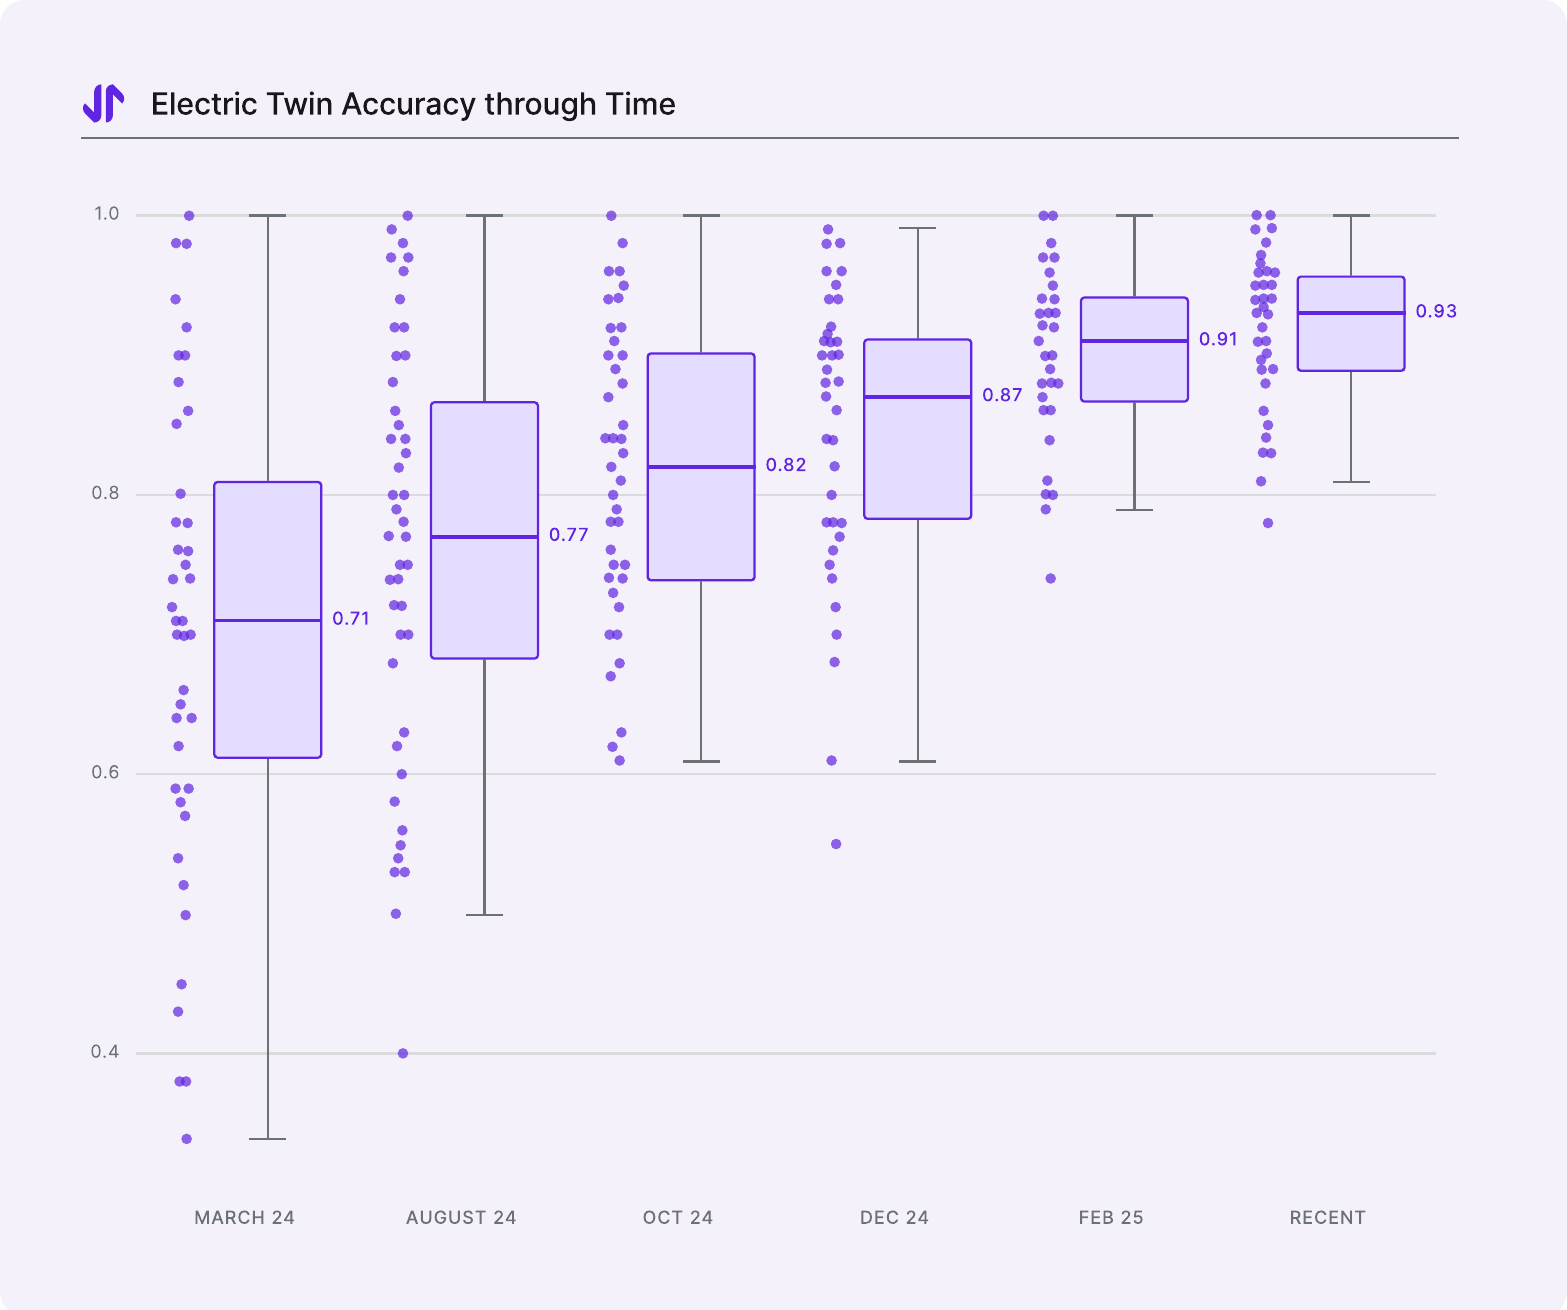
Median NDAM across the evaluation datasets, March 2024 to recent. Each dot is one dataset; the spread narrows as the median rises.
The median has gone from 0.71 to 0.93 — an average improvement of around 20% — and the spread has tightened alongside it, which matters as much as the median.
Beyond survey questions
Hold-out testing is not limited to multiple-choice survey questions. Two further evaluations cover the things you are likely to actually put in front of an audience.
Stimulus and creative testing
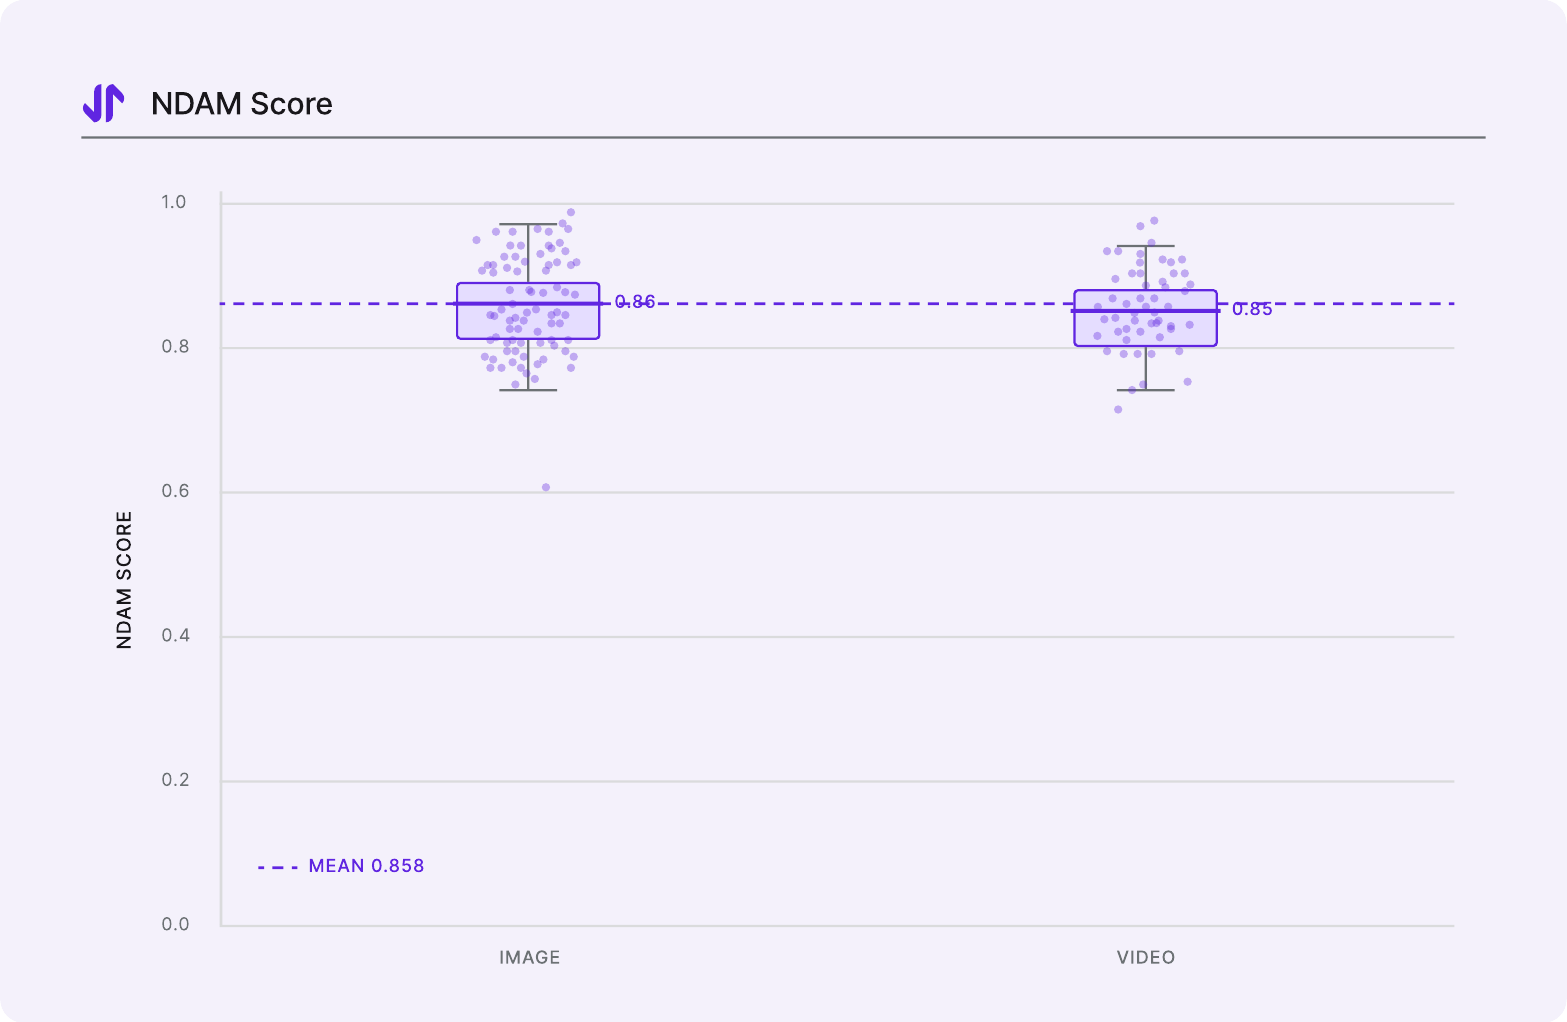
NDAM by asset type. Performance was consistent across industry and question type.
Synthetic audiences predict real reactions to visual assets with a mean NDAM of 85.8% — 86% for images, 85% for video. This was validated against a human benchmark of 4,000 participants across 18 images and 6 videos of up to three minutes, with the same strict isolation: no opinions or attitudes about the assets were used to build the personas.
Sentiment tracks too, not just distribution shape. Mean Likert scores land within about a tenth of a point of ground truth (3.07 vs 3.15 for images, 3.31 vs 3.31 for video), with correlations of r = 0.909 and r = 0.861. Top-2 Box scores come within 0.3% for images and 1.4% for video.
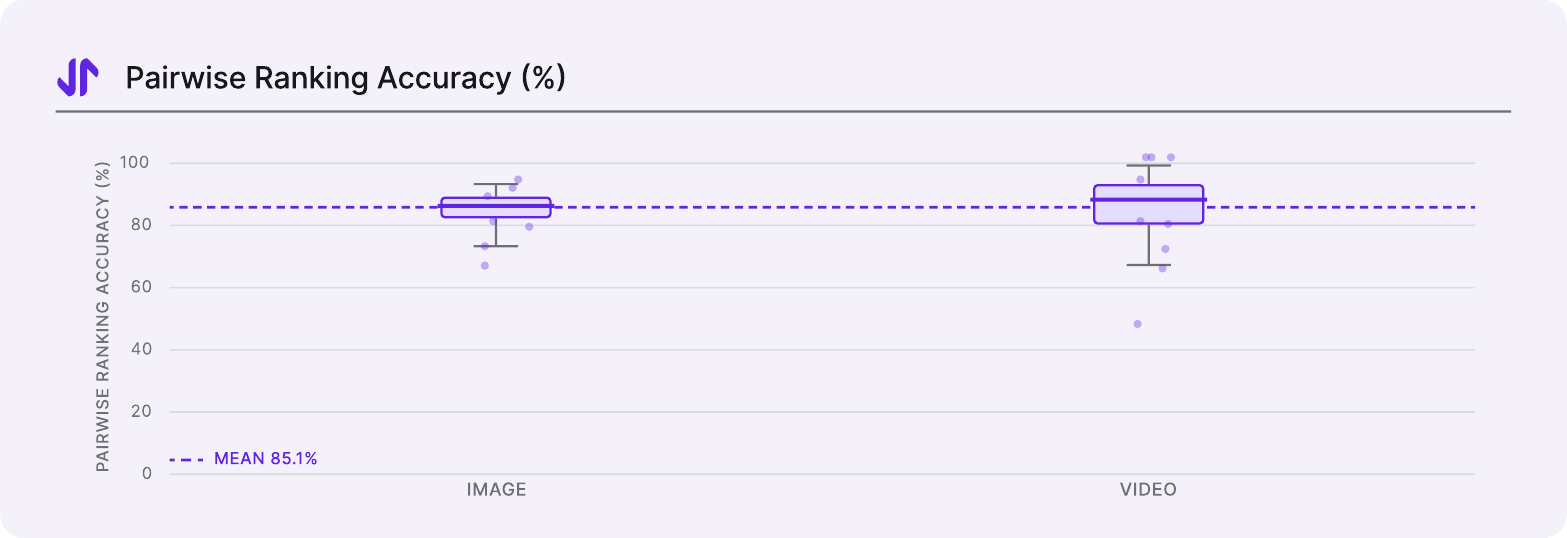
Pairwise ranking accuracy — how often the modelled audience picks the same winner as the real one.
For the question people actually ask of creative testing — which one wins? — head-to-head matchups with a meaningful real preference (more than 2% difference in Top-2 Box) had the personas picking the winning asset about 85% of the time. That is the number to have in mind when using stimuli in a survey.
Focus groups and debates
Qualitative output is evaluated too, on two dimensions: whether the topics it surfaces match real survey distributions, and whether the voices sound human.
- Debates were compared against nationally representative UK surveys across politics, climate, media and consumer topics, scoring an average 0.88 NDAM — strong alignment between the themes emerging from a synthetic debate and actual polling data.
- Focus groups are scored differently, because the free-text conversation is the output. Fifteen groups of five participants were run across nine datasets, personas built only from hold-out data, with no constraint on how they could answer. The free-text answers were then coded back to the original survey options and compared to ground truth: 0.86 NDAM, against 0.92 for the structured survey equivalent.
- A blind Turing test of voice put three scenarios (UK issues, AI banking, football club ownership) to three AI judges. In 6 of 9 judgments the synthetic group was rated more authentic than the real one.
The last one is a caution as much as a credential. Synthetic commentary reads convincingly enough that it must be labelled as modelled whenever it leaves the product.
Reading these numbers honestly
"92% accurate" is not a property of Merlin. It is the result of a particular set of hold-out tests, on particular audiences, using a particular metric, at a particular date. A different audience, a topic further from the seed data, or a question phrased loosely will not perform like the average of those tests. This is exactly why every result in the product carries its own confidence grade rather than inheriting a headline figure.
Fourth of nine is a good result, not a hedge. The pre-registered comparison put Merlin against eight conventional survey modes — including methods that cost orders of magnitude more and take weeks longer. Ranking mid-pack on accuracy while returning answers in seconds is the trade being offered.
Most of these figures are ours. Electric Twin produced the hold-out evaluation, the visual asset benchmark, the qualitative scores and The Times case study. The survey-mode comparison is external and pre-registered. When you are presenting to a sceptical audience, lead with the external one and be upfront about the provenance of the others — it is a stronger position than being asked.
What is measured, and what is not
| Measured | Not measured |
|---|---|
| How closely a predicted distribution matches a real one | Whether people did what they said they would |
| Performance on questions related to the seed data | Performance on topics far from it |
| Aggregate accuracy across an audience | The accuracy of any one modelled respondent |
| Structured survey answers, image and video stimuli | Whether the audience you defined is the right one for your decision |
| Focus group and debate output, coded back to survey options | Any individual synthetic quote as a factual statement |
The right-hand column is not a gap to be apologised for — it is the boundary of the claim. Presenting a result covers how to work inside it.
Next
- Confidence grades — how an individual result is scored in the product