Audience analysis
Audience analysis is something you do to an audience, from the Analyse audience button on the audience page — not from the study toolbar.
It tells you what makes a sub-audience different from the rest of your audience, and provides a summary profile of the group — what its members have in common that the rest of the population doesn’t.
Running an analysis
- Go to the Audiences page and click the audience you want
- Click Analyse audience
- Merlin lists the attribute themes it can analyse against — demographics, media consumption patterns, news consumption habits, free time activities, technology usage, spending habits, entertainment preferences, concerns. Remove any you don’t want with the × on the chip
- Click Run analysis
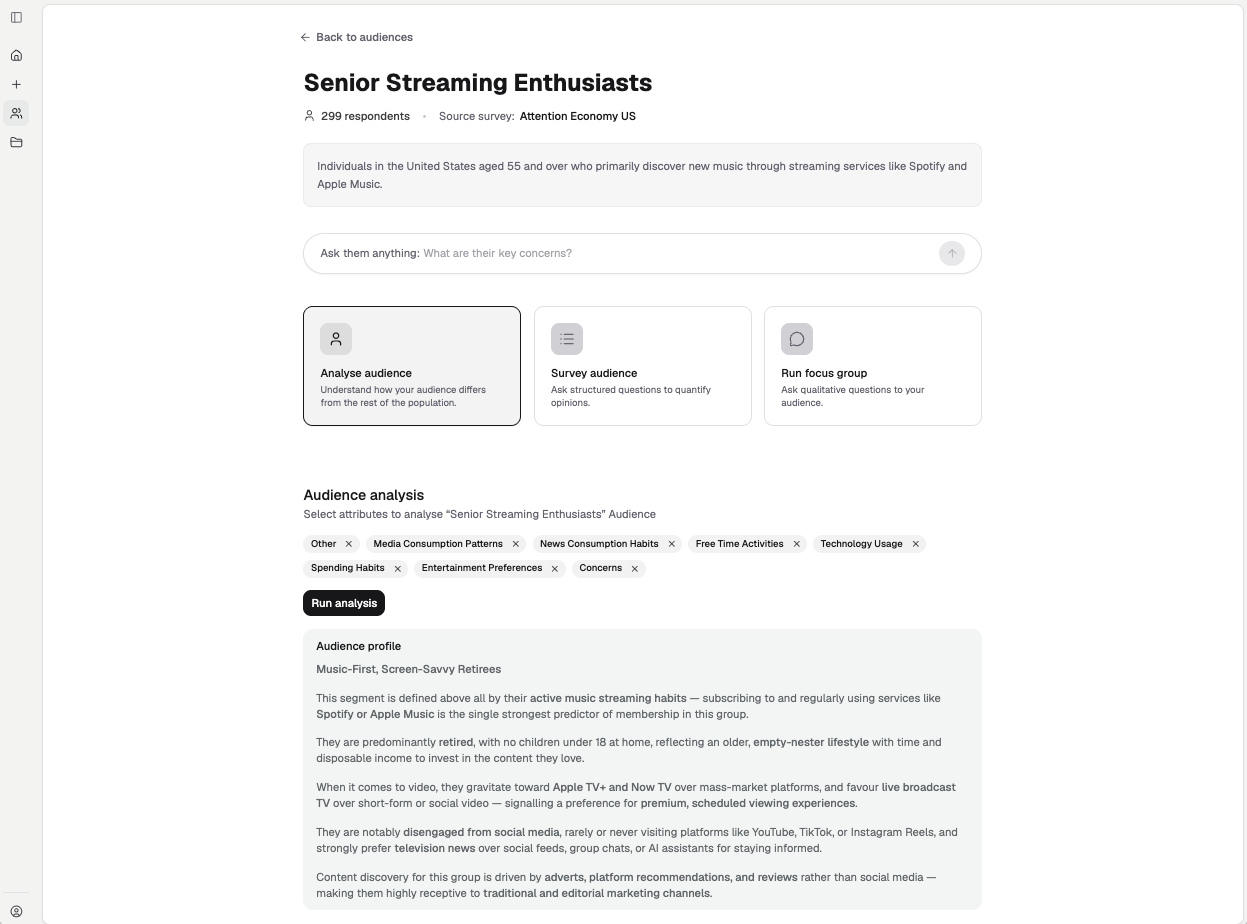
A finished analysis. Merlin titles the group — here “Music-First, Screen-Savvy Retirees” — and writes up what defines it, with the ranked influences below.
What you’ll see
The audience page itself carries the basics before you run anything: the number of respondents in the audience, the source seed data it was built from, and a one-line description of the group.
The analysis adds three things.
-
Audience profile — a written summary of who these people are and what characterises them.
-
Top influences — the traits that most strongly define this audience compared with everyone else, ranked and shown with a strength bar. For an audience of music streamers, the top influences come back as music streaming usage, music consumption ranking, and music streaming service subscription status — the answers that most reliably tell you someone belongs to this group.
-
Explore by theme — the same characteristics grouped by question theme, so you can open up demographics, or attitudes, or behaviours on their own. Each row expands for the detail behind it.
There’s also an Ask them anything field at the top of the audience page, if a specific question about the group is quicker than reading the whole profile.
How “top influences” works
Under the hood: Merlin runs regression analysis comparing your audience to the rest of the population. For every question in the original seed data, we calculate how much more or less likely this audience is to give each answer. The characteristics shown are those with the strongest statistical relationships — essentially, the answers that best predict whether someone belongs to this audience.
For example, if you’ve built an audience of “budget-conscious shoppers”, you might see:
- “Strongly agrees with ‘I always compare prices’” (87% vs 45% overall)
- “Income under $40k” (65% vs 38% overall)
- “Shops at discount stores weekly” (71% vs 42% overall)
This approach reveals what truly defines your audience.
Next
Back to Audiences to create and refine groups. Then:
- Plots — chart a question already in your data
- Surveys — ask questions not in your data
- Focus groups — explore why patterns exist