Audiences
An audience is a group of synthetic personas, defined by seed data, you can query on demand. You can create groups within an overall audience based on specific characteristics — for example, young urban professionals, concerned parents, or price-sensitive shoppers.
Merlin lets you create audiences in multiple ways, compare them side by side, and use machine learning to understand what makes each one unique. This is how you find “the right person” for your message, product or idea.
Why audiences matter
Instead of treating everyone as one homogeneous group, defining audiences lets you:
- Identify distinct types of people with different needs, preferences and behaviours
- Compare how different groups respond to questions and messages
- Understand what makes each audience unique
- Target communications to the audiences most likely to resonate with your message or want your product
- Test hypotheses about differences between groups
Creating audiences
From existing seed data
Using the Plot tool — a plot charts a question already in your seed data:
- Click Plot in the toolbar at the bottom of a study
- Under Audiences, choose what you want to plot against
- Choose a survey question (e.g. “What is your age?”)
- Click Generate plot
- Click the answers you want (e.g. “18 - 24”, “25 - 34”) — the Audience explorer panel opens on the right, listing what you’ve selected and how many respondents match it
- Click Save audience
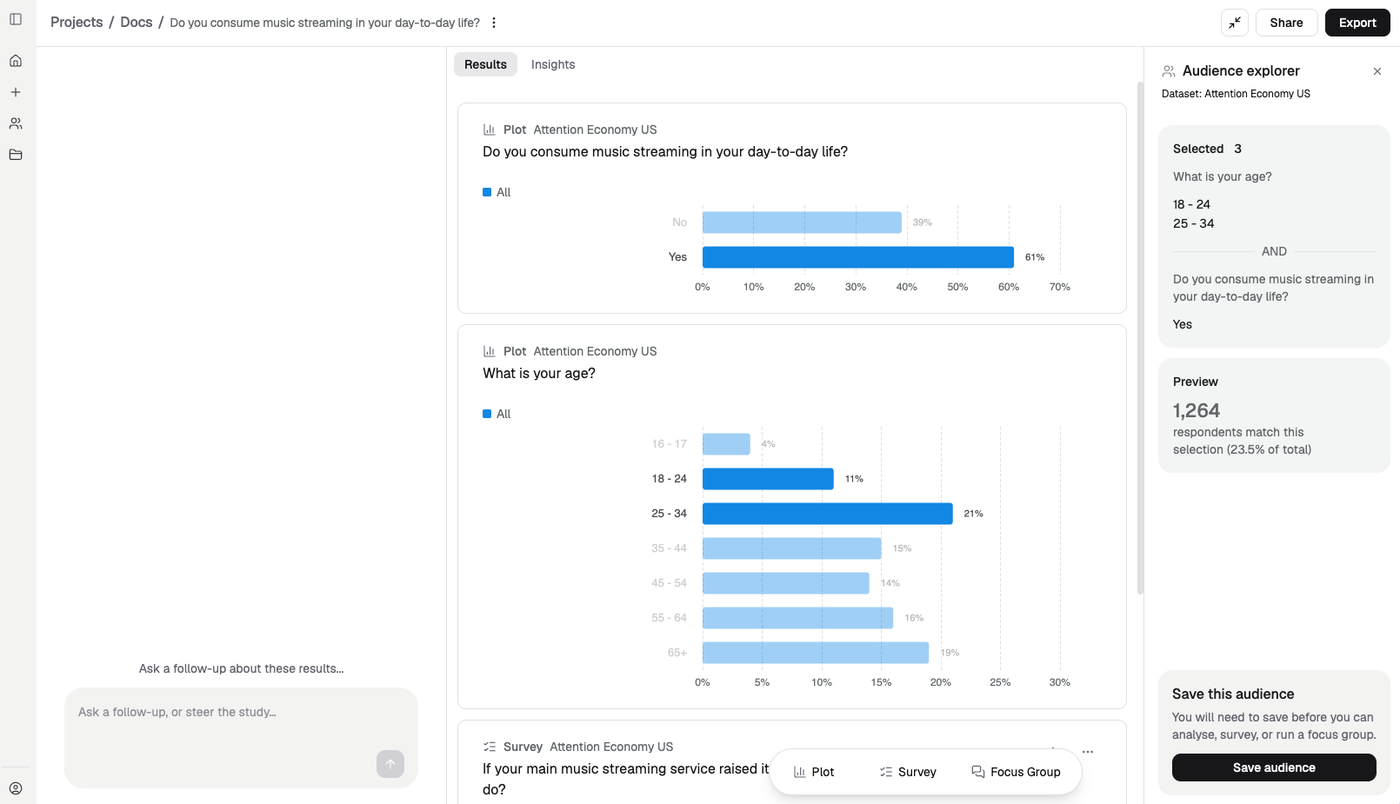
Two plots, one selection. Age 18–34 AND streams music — 1,264 respondents, 23.5% of the dataset.
The respondent count in the panel updates as you click.
Selections combine across plots. Click “18 - 24” and “25 - 34” on an age plot, then “Yes” on a music streaming plot, and the panel shows both conditions joined with AND — everyone aged 18 to 34 who streams music.
You can also create audiences from the seed data on the data page, where all of your seed data is displayed in one place.
From synthetic surveys
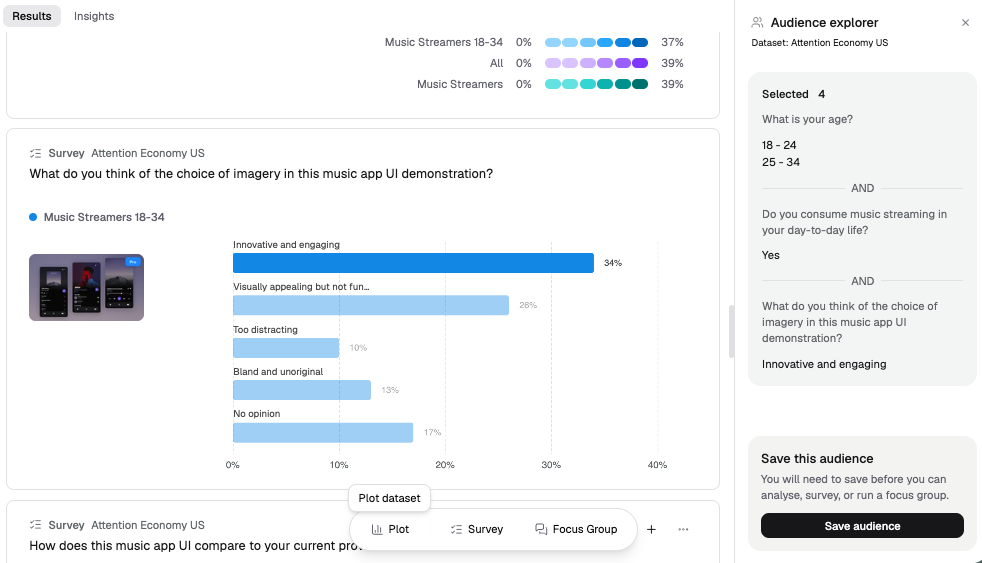
You can also create audiences based on answers to questions that weren’t in the original seed data.
- Use the Survey tool to ask a new question (e.g. “Would you buy this product?”)
- After results appear, click the answer choices you want
- The Audience explorer panel on the right shows the selection you’ve made and the number of respondents it covers
- Click Save audience
From natural language
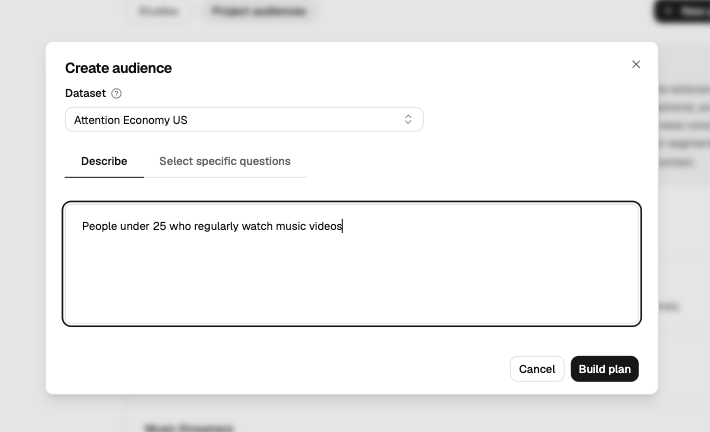
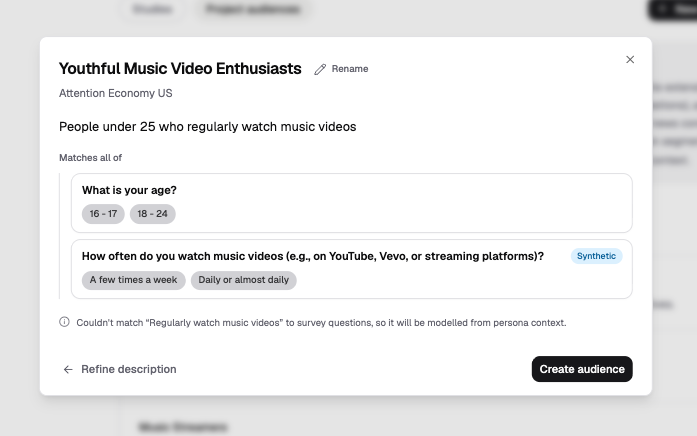
You can also create an audience by describing it.
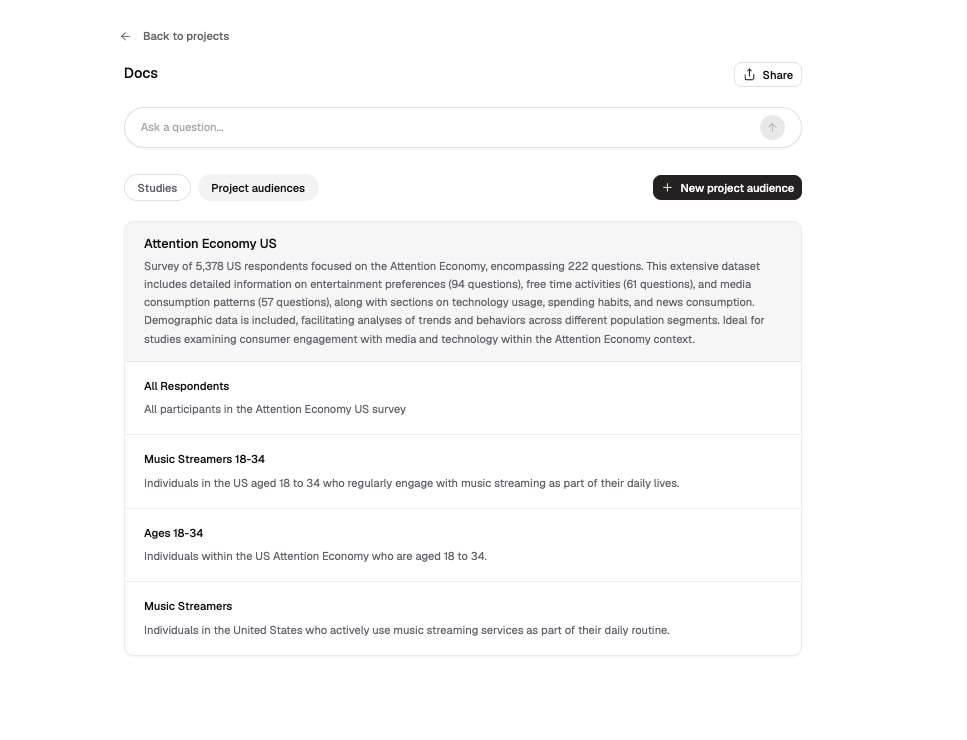
- Go to the Audiences page in the left-hand sidebar
- Click Create audience
- Pick the dataset to build from
- On the Describe tab, describe the audience you want: “Environmentally conscious millennials”
- Click Build Preview to see how Merlin has interpreted it, then save
Merlin will identify a set of questions, either from the seed data or synthetic questions, that define that segment, and build it for you.
From your own segmentation
Our team can also build audiences for you using other statistical techniques — including your existing in-house segmentation, so your Merlin work lines up with the segments your organisation already reports against. Speak to your account team.
Understanding your audiences
Once you’ve created an audience, Merlin helps you understand what makes it distinctive. Open it from the Audiences page and click Analyse audience — Merlin writes a profile of the group and ranks the traits that separate it from everyone else.
See Audience analysis for what it shows and how the statistics work.
Comparing audiences
One of Merlin’s most powerful features is multi-audience comparison. You can select up to five audiences at once and compare how they respond to questions, messages and content.
Selecting multiple audiences
You choose the audiences inside the tool itself, not from the sidebar:
- Open Plot or Survey
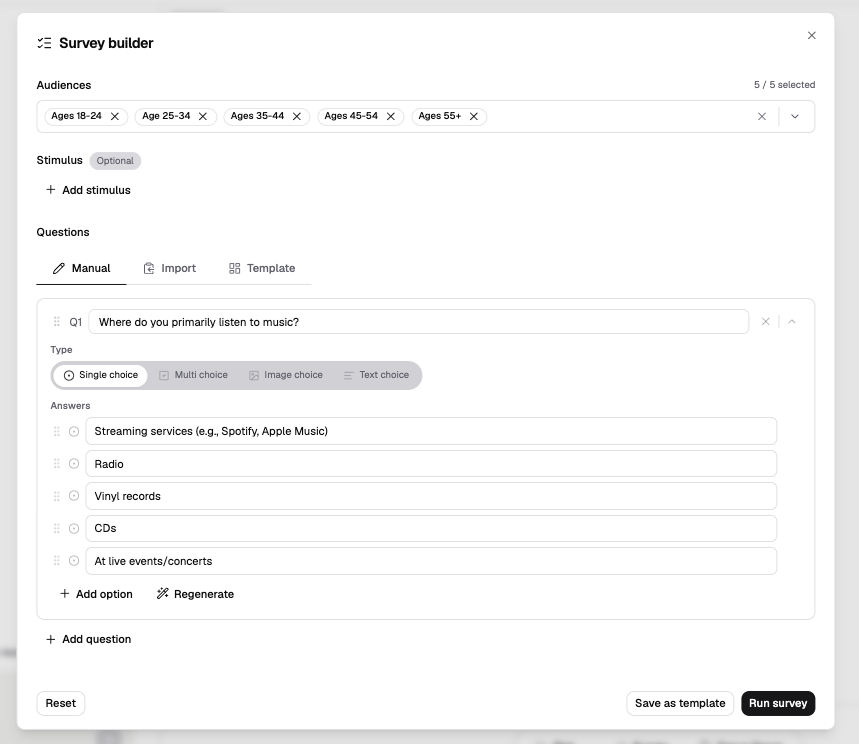
- Under Audiences, select up to five — the count in the corner tracks how many you’ve used
- Include All of <dataset> to keep the whole population in view as a baseline
Results are then colour-coded by audience, one colour per group.
You can see this in the Survey builder, where the selected audiences appear as chips along the top.
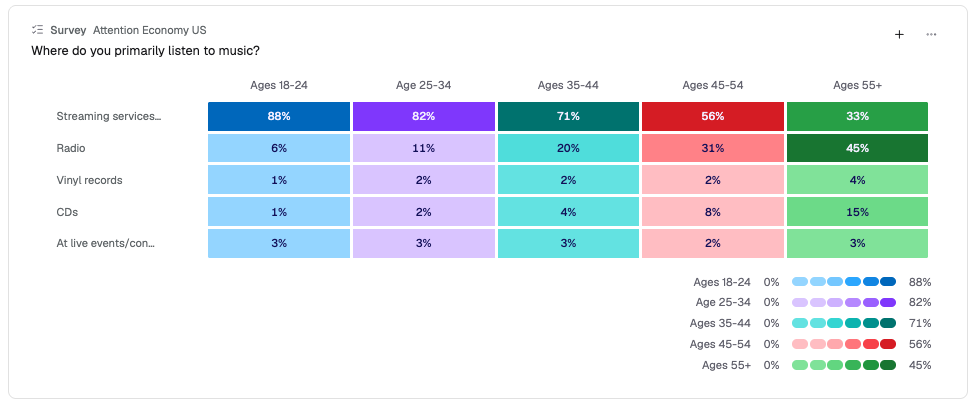
A result that looks unremarkable against the whole population often turns out to be sharply different between two audiences.
Managing audiences
Both live on the Audiences page. Hover the audience you want and a … menu appears at the end of its row.
Renaming
- Hover the audience row and click …
- Select Rename audience
- Enter a new name and save
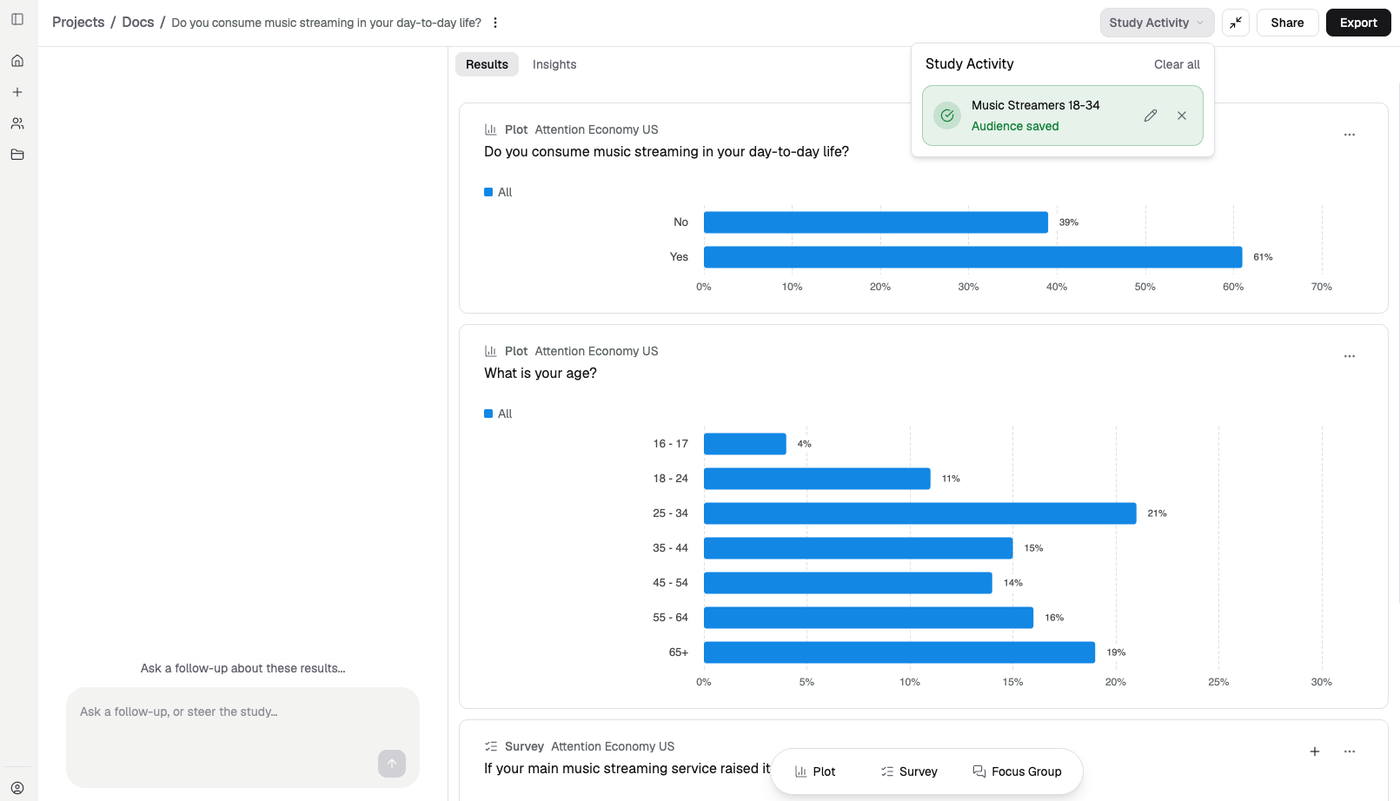
Saved audiences are confirmed in the Study Activity tray, which also lets you rename one on the spot.
Deleting
- Hover the audience row and click …
- Select Delete audience
- Confirm deletion
Note: deleting an audience doesn’t delete the underlying personas or data — just the saved filter. You can always recreate it.
Next
- Audience analysis — what makes an audience distinctive
- Plots — chart a question already in your data
- Surveys — ask questions not in your data
- Focus groups — explore why patterns exist