Surveys
What are synthetic surveys?
A synthetic survey is a new question you ask to your audience. Merlin uses what it knows about each persona from the original seed data to predict how they would answer your new question. To chart a question already in the seed data, use Plots instead.
Under the hood: When you submit a question, Merlin retrieves each persona’s profile based on their answers to the original seed data, and asks “Given what you know about these people, how would they answer?”
This approach is tested by withholding real answers and comparing Merlin’s predicted distribution against them — 92% distribution accuracy across hundreds of survey hold-out tests, against a human noise level of 94%. See How we know it works for what that figure covers, and what it doesn't.
Creating your first synthetic survey
Basic setup
- Click Survey in the toolbar at the bottom of a study
- The Survey builder opens with three key settings:
- Audiences — where you select up to five audiences to survey
- Stimulus (optional) — where you give stimuli in the form of images or text to ask questions about
- Questions — where you configure your survey
- Manual — configure the questions yourself
- Import — paste in a survey you’ve written elsewhere
- Template — use a pre-existing template you or your team have previously built
- Once configured, click Run survey
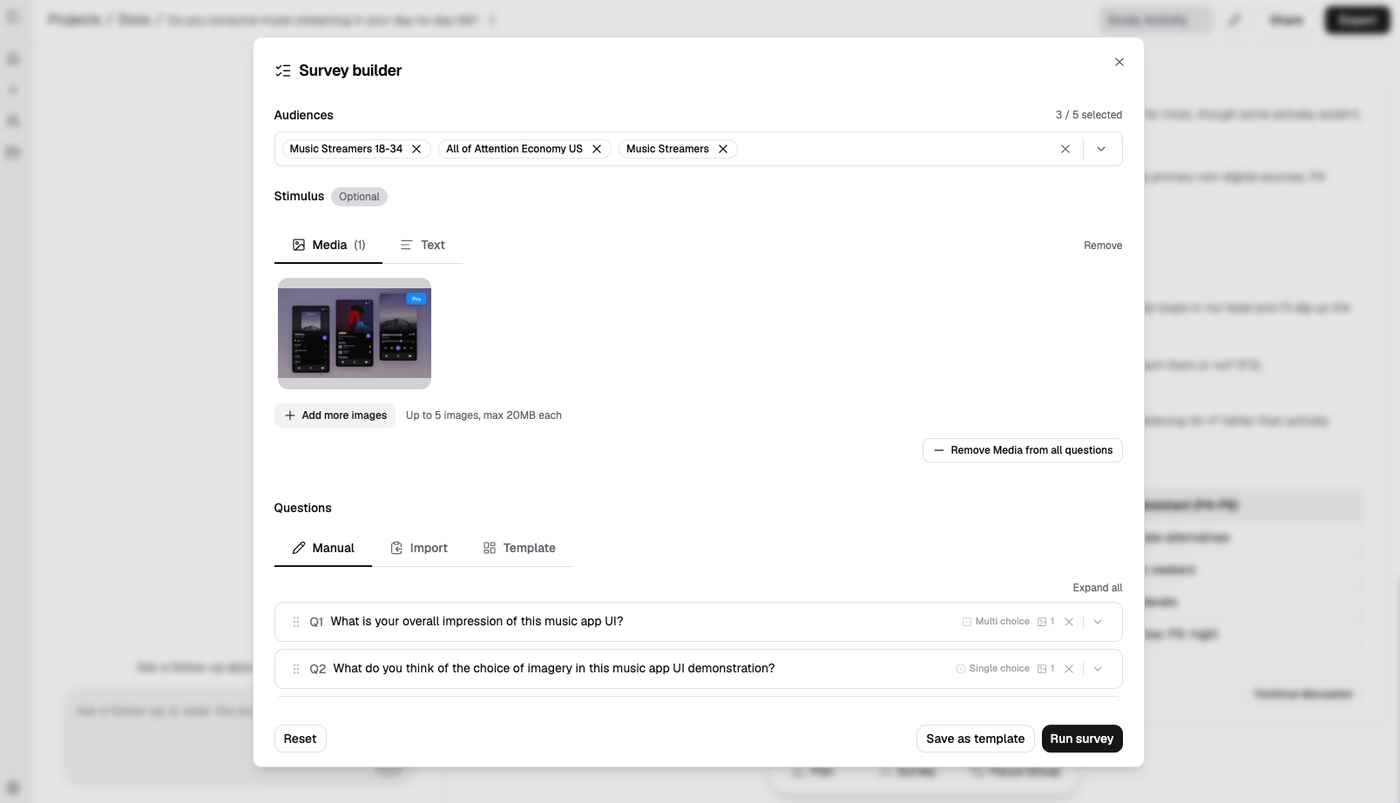
The Survey builder: audiences at the top, an optional stimulus, then your questions.
Results appear on a card in the study feed, colour-coded by audience.
Building survey questions
In the Question tab:
- Click the Q1: Write a question… field — the question expands to show its settings
- Enter your question in the text field
- Select the type of question you want it to be, this will determine how the personas answer
- Single choice — each persona can select only one answer option
- Multi-choice — each persona can select more than one answer option. You can choose how many.
- Image choice — personas choose between image stimuli presented as answer options
- Text choice — personas choose between text stimuli presented as answer options
- Fill in the answer options underneath, adding more with Add option. If you’d rather not write them all out, Auto-generate will draft a set from your question, and Regenerate will try again
- Build as many questions into your survey as you need with Add question, then click Run survey
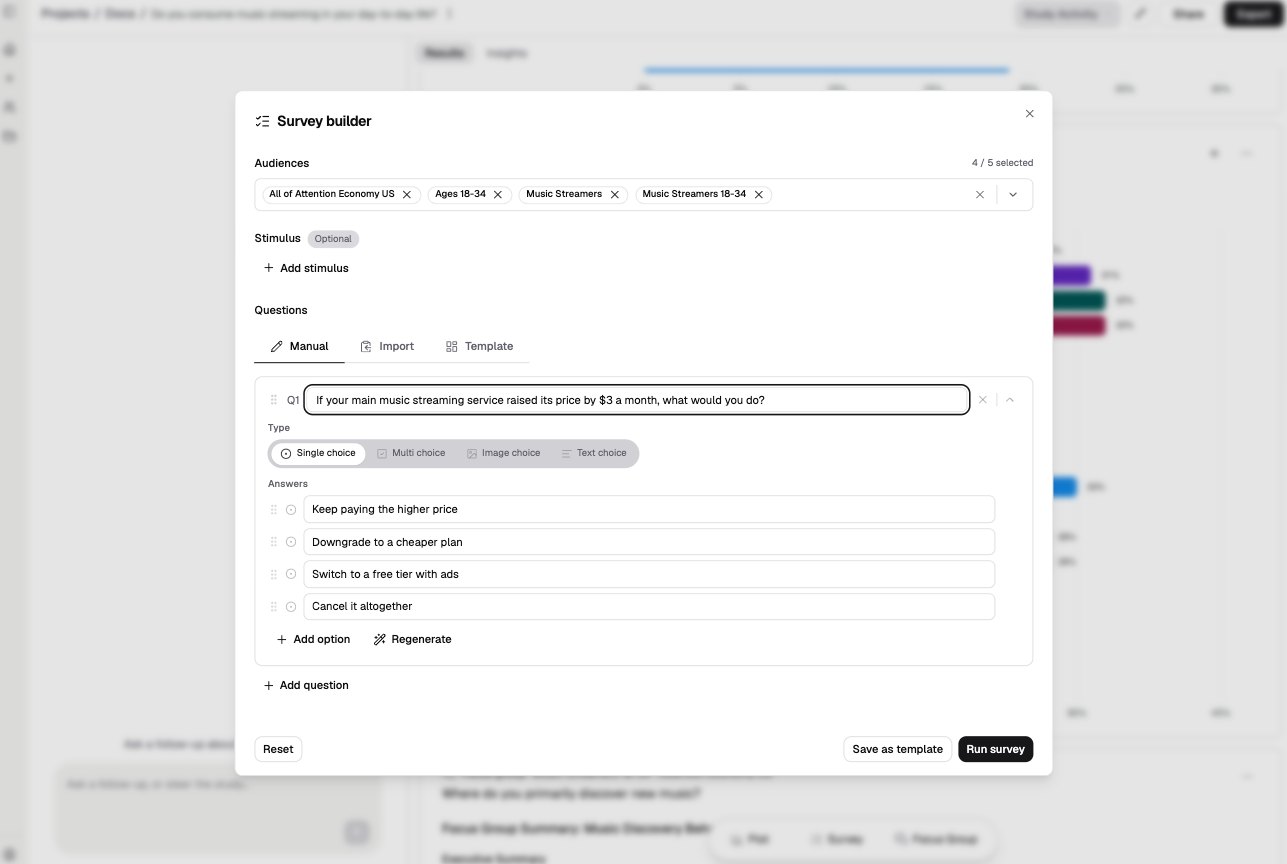
An expanded question. The type you pick determines how personas answer; Regenerate redrafts the options.
Comparing audiences
When you’ve selected multiple audiences, the results on a card are colour coded to show how each audience answered differently.
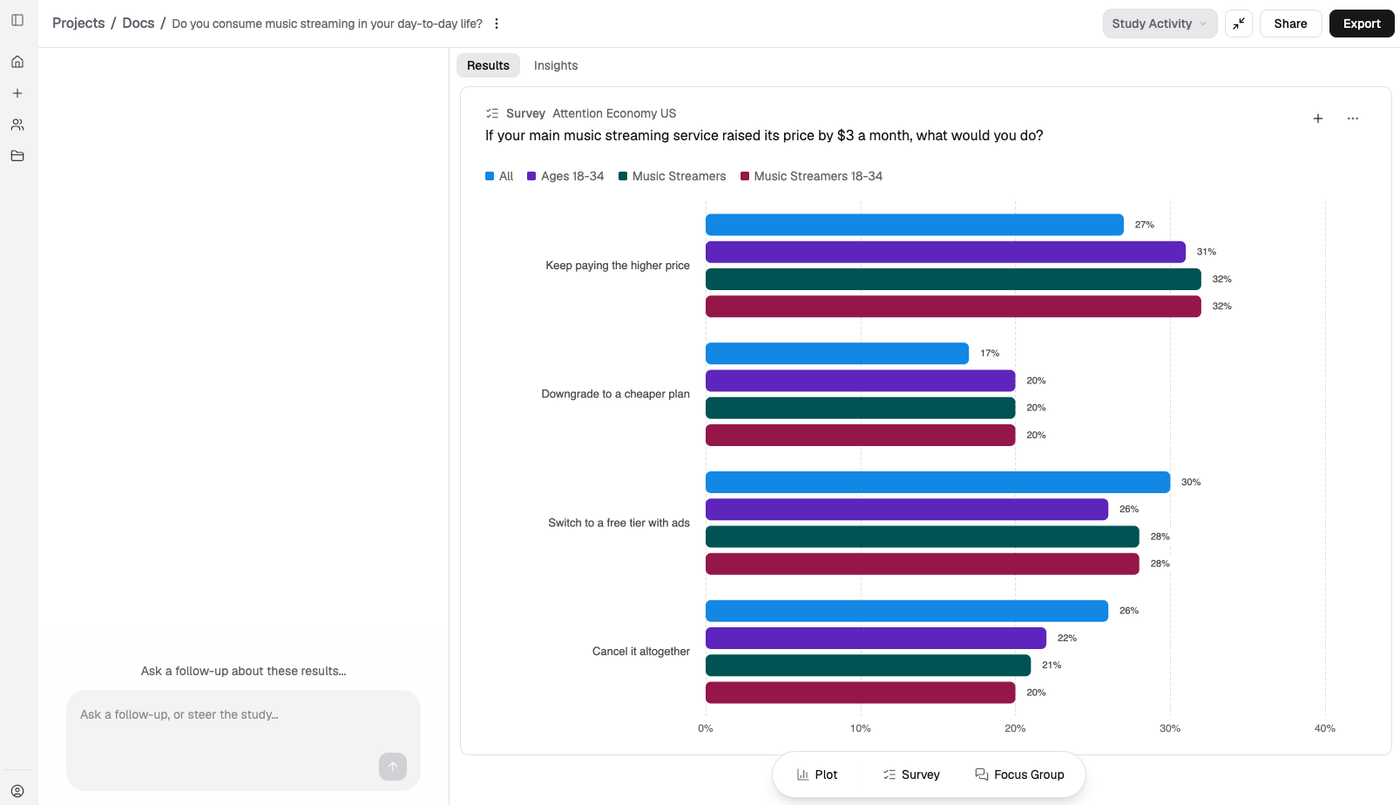
The same question across four audiences. Music streamers aged 18–34 are the most willing to absorb the price rise, at 32% against 27% overall.
Working with stimuli
Add stimuli with Add stimulus in the survey builder. There are two tabs: Media for images — up to five, 20MB each — and Text. Once attached, each question shows a small badge with the number of stimuli applied to it, and Remove Media from all questions clears them in one go.
Stimulus testing has been benchmarked separately against 4,000 human participants: mean NDAM of 85.8% across images and video, and the modelled audience picks the same winner as the real one around 85% of the time in head-to-head comparisons. See How we know it works.
Stimuli can be applied as either context for the question, or as answer options if you have multiple stimuli.
Ask again
Once a result is on the study feed, you may want to adjust it or ask a variant.
You can replicate its configuration by clicking the … menu in the top right corner of the card and selecting Ask again. The survey builder reopens with exactly the configuration that produced the result. Make your adjustments, and run it again.
Chart type configuration
The same menu also holds Chart type, for changing how the result is drawn, and Export, which takes that single result out as CSV or PNG, or copies it to your clipboard.
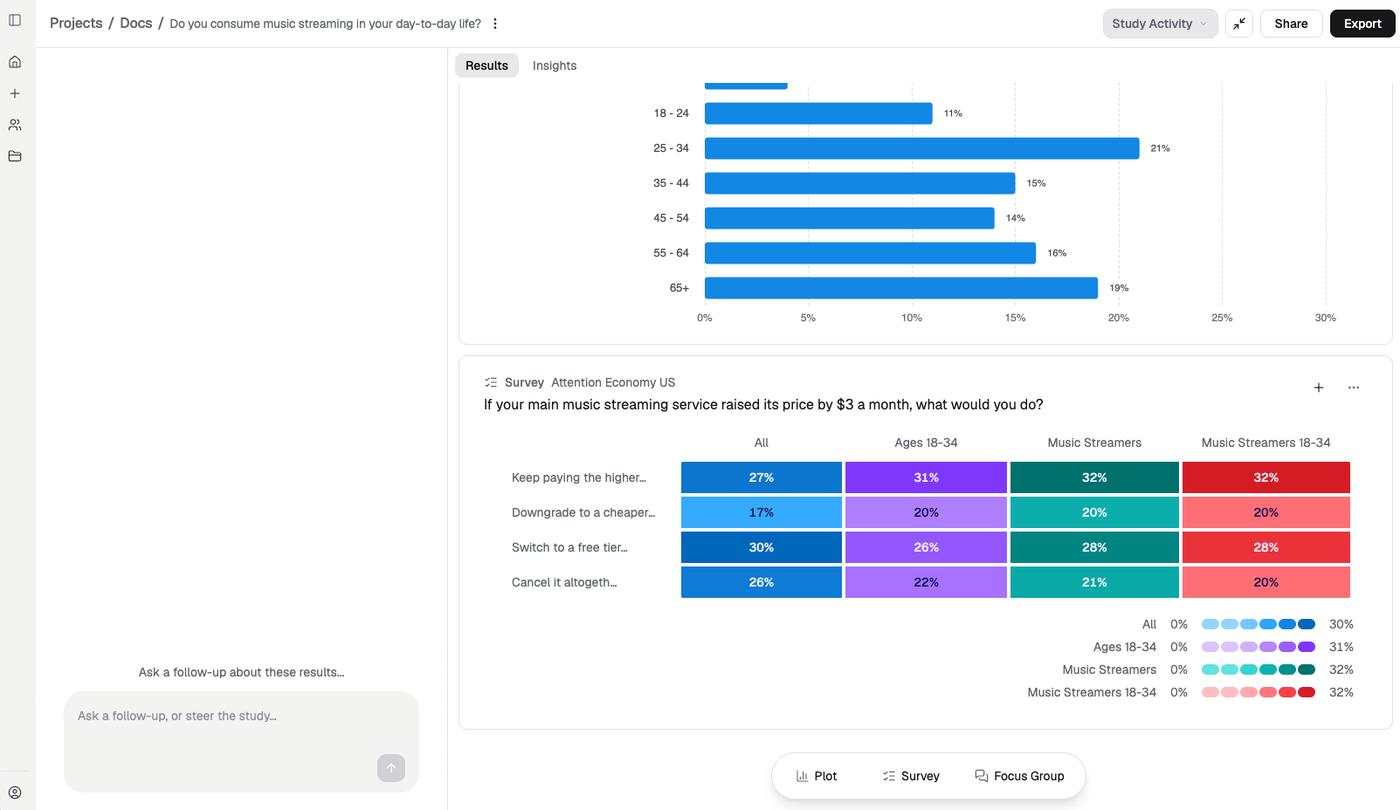
The same result as a panel chart. Grouped bars are easier for comparing one answer across audiences; panels are easier for reading one audience down its options.
Templates
Some teams have surveys that are run across different stimuli frequently. This can be particularly important for drawing comparisons across adjustments to stimuli with different audiences.
Our templates feature is designed to serve this use case. You can save surveys you run frequently as templates, so when you come to run them again, you can simply apply the template, add your stimuli, and run it.
You can save new templates by building the survey in the survey builder and then clicking Save as template.
You can access saved templates under Questions → Template. Click the template you want to apply and the manual builder populates with it configured. Then apply your stimuli, and run.
Templates can be saved either in your account, or across your organisation if your team needs to always work from the same set of questions.
Next
- Plots — chart a question already in your data
- Focus groups — explore the reasoning behind the numbers
- Confidence grades — how much weight to put on a result